Technical analysis chart patterns indicators for crypto
Welcome to the dynamic, ever-evolving world of cryptocurrency trading. Unlike traditional stock markets that open and close at set hours, the crypto market never sleeps. Prices fluctuate wildly 24/7, driven by global news, social media sentiment, and macroeconomic factors. To survive and thrive in this high-octane environment, you cannot rely on guesswork. You need a reliable, objective roadmap.
That is exactly where Technical analysis (chart patterns, indicators) for crypto comes into play. By analyzing historical price action and trading volume, traders can forecast future market behavior with a much higher degree of probability. Whether you are a long-term investor looking for the perfect entry point or a day trader capitalizing on minute-by-minute volatility, mastering the art of reading charts is your ultimate edge.
In this comprehensive guide, we will break down everything you need to know about navigating the crypto markets using data-driven strategies, from foundational price action to advanced momentum indicators.

The Foundation of Crypto Market Analysis
Before diving into complex formulas, you must understand the core philosophy behind technical analysis. At its heart, technical analysis is the study of market psychology. Every green and red candle on a chart represents a battle between buyers (bulls) and sellers (bears). By recognizing repeating behaviors in these battles, traders can identify high-probability setups.
Establishing the Blueprint: Support and Resistance
The absolute bedrock of any trading strategy is knowing where price is likely to bounce and where it is likely to break. Support is a price level where downward momentum tends to pause due to a concentration of demand (buying interest). Resistance is the opposite—a price level where upward momentum is halted by an influx of supply (selling interest).
Learning how to draw support and resistance zones correctly is the first step to profitable trading. A common mistake is drawing thin, exact lines on a chart. In reality, the crypto market is highly volatile, and prices often “wick” past these exact numbers before reversing. Always draw these areas as zones or boxes rather than single lines. Look for areas on the chart where the price has touched and reversed at least three times. The more touches a zone has, the stronger it becomes.
Mastering Price Action: Essential Chart Patterns
Once you have your support and resistance zones mapped out, the next step is identifying chart patterns. These patterns are visual representations of buying and selling pressure consolidating before a major move. They generally fall into two categories: continuation patterns (signaling the current trend will resume) and reversal patterns (signaling the trend is about to change).
Spotting Bullish and Bearish Patterns in Bitcoin
Bitcoin dictates the broader market’s direction. Therefore, spotting bullish and bearish chart patterns in bitcoin is a crucial skill even if you only trade smaller altcoins.
- Bullish Patterns: Look for Ascending Triangles, Bull Flags, and Cup and Handle formations. For example, a Bull Flag occurs when Bitcoin experiences a massive vertical price spike (the flagpole), followed by a downward-sloping consolidation channel (the flag). When price breaks out of the top of this channel, it often surges upward by the length of the initial flagpole.
- Bearish Patterns: Conversely, keep an eye out for Descending Triangles and Bear Flags, which indicate that sellers are continually stepping in at lower and lower prices, eventually leading to a breakdown.

The Classic Reversal: Head and Shoulders
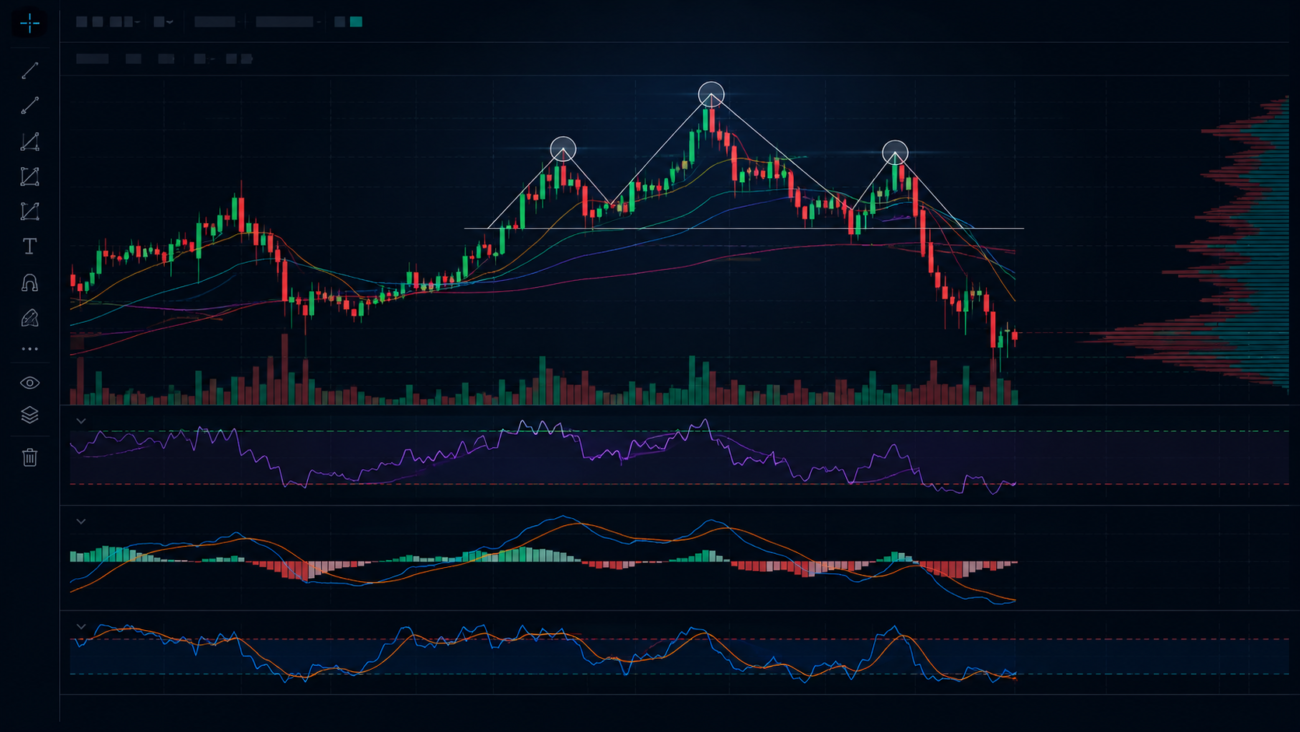
One of the most reliable and widely recognized structures is the Head and Shoulders pattern. Identifying head and shoulders patterns in crypto markets can save you from severe market downturns. The pattern consists of three peaks: a left shoulder, a higher peak (the head), and a lower right shoulder.
The low points between these peaks form the “neckline.” When the price breaks below this neckline on high volume, it signals a major shift from a bullish trend to a bearish one. There is also an “Inverse Head and Shoulders,” which signals the exact opposite—a bottoming out of the market and a subsequent bullish reversal.
Reading the Micro-Story: Japanese Candlesticks
While broad chart patterns tell the macro story, individual candles tell the micro story. Identifying trend reversals with japanese candlesticks allows traders to get early entries before a larger pattern fully forms.
Pay close attention to these reversal candles:
- Doji: A cross-shaped candle indicating profound indecision between buyers and sellers. When found at the top or bottom of a trend, a Doji often precedes a reversal.
- Hammer / Pin Bar: A candle with a small body and a long lower wick. This shows that sellers pushed the price down, but buyers aggressively bought the dip, pushing the price back up. It is a highly bullish signal when found at a support zone.
- Engulfing Candles: A bullish engulfing pattern occurs when a small red candle is immediately followed by a larger green candle that completely “engulfs” the previous day’s price action. This signifies a sudden, violent shift in momentum.
Leveraging Technical Analysis Crypto Indicators
While price action and patterns form your foundation, indicators provide confirmation. Technical analysis crypto indicators are mathematical calculations based on price, volume, or open interest. They help filter out market noise and provide objective signals.
Finding the Trend: Moving Averages
Moving averages smooth out price action over a specified period. The two most common types are Simple Moving Averages (SMA) and Exponential Moving Averages (EMA). Understanding the difference between exponential vs simple moving averages for momentum is vital.
The SMA calculates the average price over a set number of periods equally. The EMA, however, places more weight on recent price data. Because crypto is inherently fast-paced and news-driven, many traders prefer the EMA, as it reacts quicker to sudden price shifts, allowing traders to catch momentum earlier.
When it comes to the best moving average settings for crypto swing trading, the industry standards are highly effective:
- 20 EMA: Acts as dynamic support in a strong, fast-moving trend.
- 50 SMA: The intermediate-term trend indicator.
- 200 SMA: The ultimate macro trend filter. If the price is above the 200 SMA, the market is generally considered bullish. If it crosses below, a crypto winter might be brewing.
Momentum Oscillators: RSI vs MACD
To gauge the speed and change of price movements, traders use momentum oscillators. Understanding the nuances of the relative strength index vs macd for entry signals will drastically improve your win rate.
- RSI (Relative Strength Index): The RSI oscillates between 0 and 100. Traditionally, a reading above 70 indicates a crypto asset is “overbought” (due for a pullback), while a reading below 30 indicates it is “oversold” (due for a bounce).
- MACD (Moving Average Convergence Divergence): The MACD focuses on the relationship between two moving averages (usually the 12 and 26 EMA). It generates signals through crossovers. When the MACD line crosses above the signal line, it’s a bullish entry signal.
How to combine them: Use the RSI to find extreme conditions (e.g., an altcoin dropping to an RSI of 25) and wait for a bullish MACD crossover to confirm that the downward momentum has officially exhausted itself before entering.

Harnessing Divergence in Altcoins
One of the most profitable, yet underutilized, techniques is divergence trading. Exploring divergence trading strategies for altcoins can yield massive returns, particularly in mid-to-low cap markets where momentum shifts violently.
Bullish divergence occurs when the price of an altcoin makes a lower low, but the RSI (or MACD) makes a higher low. This discrepancy tells you that while the price is dropping, the actual selling pressure is fading. It is essentially a trap for late short-sellers, often resulting in explosive upward reversals.
Measuring the Swings: Bollinger Bands
Cryptocurrency is synonymous with extreme volatility. Using bollinger bands to measure market volatility is an excellent way to prepare for explosive price movements. Bollinger Bands consist of a simple moving average (the middle band) and an upper and lower band calculated using standard deviations.
When the bands contract tightly together, it’s known as a “squeeze.” In crypto, a squeeze indicates that volatility has dropped to unusually low levels, acting like a coiled spring. A massive breakout is imminent. Traders will wait for the price to break either above the upper band or below the lower band with high volume to ride the incoming wave.
Advanced Technical Tools for Crypto Traders
Once you are comfortable with the basics and standard indicators, you can elevate your analysis by integrating advanced tools used by institutional traders and seasoned professionals.
Price Discovery and the Golden Ratio
Because cryptocurrencies frequently break into all-time highs where no historical resistance exists, traders need a way to project where the price might go. Learning how to use fibonacci retracement for price targets solves this problem.
Based on a mathematical sequence found in nature, the Fibonacci tool is drawn from a swing low to a swing high. It plots horizontal levels where the price is likely to retrace and find support (commonly the 0.382, 0.5, and 0.618 levels). The 0.618 is known as the “Golden Pocket” and is highly respected by crypto trading algorithms. Conversely, Fibonacci extensions (like the 1.618) are used to predict future price targets when an asset enters price discovery mode.
Decoding the Volume Profile
Standard volume bars at the bottom of a chart tell you when trading occurred. However, understanding volume profile for breakout confirmation tells you at what price the most trading occurred.
Volume Profile is plotted on the Y-axis (vertically). It identifies the Point of Control (POC)—the exact price level with the highest traded volume over a given period. If an asset is breaking out above a resistance zone, checking the volume profile can confirm if there are “low volume nodes” above. If there is little historical volume above the current price, the asset can experience rapid, frictionless upward movement.

Riding Trends with the Ichimoku Cloud
Originating in Japan, the Ichimoku Kinko Hyo is an all-in-one indicator that defines support, resistance, trend direction, and momentum. While it looks visually overwhelming at first, interpreting ichimoku cloud signals for crypto trends is incredibly effective for trend-following strategies.
The most important element is the “Kumo” or the Cloud.
- If the price is above the cloud, the overall trend is bullish, and the cloud acts as dynamic support.
- If the price is below the cloud, the trend is bearish, acting as dynamic resistance.
- A breakout occurs when the price aggressively pierces through the cloud, often signaling a long-term macro trend shift that you can ride for weeks or months.
High-Speed Trading: Scalping Ethereum
Not all technical analysis is meant for long-term investing. Many traders thrive on lower timeframes, capturing small price movements multiple times a day. If you want to dive into fast-paced trading, you must know the top technical indicators for scalping ethereum.
Ethereum is ideal for scalping due to its high liquidity and predictable technical adherence. For a 3-minute or 5-minute chart, scalpers heavily rely on:
- VWAP (Volume Weighted Average Price): Institutional traders use VWAP as a fair-value benchmark. Scalpers buy when ETH crosses above the VWAP and short when it crosses below.
- Stochastic RSI: Faster and more sensitive than the traditional RSI, the Stochastic RSI is perfect for spotting overbought/oversold conditions on micro-timeframes.
- EMA Ribbons: A cluster of exponential moving averages that fan out during a strong micro-trend and twist together when the trend is flattening, giving scalpers precise entry and exit triggers.
Risk Management and Avoiding Common Traps
Even the best technical analysis in the world is useless without proper risk management. The crypto market is ruthless, and a single liquidation wick can wipe out months of hard work if you aren’t protected.
Protecting Your Capital
The golden rule of crypto trading is capital preservation. Managing risk with technical stop loss placement is non-negotiable.
A stop loss should never be placed based on a random percentage of your portfolio (e.g., “I’ll sell if it drops 5%”). Instead, it must be placed based on technical invalidation. If you buy at a support zone, place your stop loss slightly below the entirety of that zone, accommodating for fake-out wicks. Alternatively, use the ATR (Average True Range) indicator to measure current market volatility and place your stop loss outside the daily noise limits.

Mistakes to Avoid
As you refine your skills, be hyper-aware of common technical analysis mistakes for crypto beginners.
- Indicator Spaghetti: Adding ten different indicators to your chart won’t make you a better trader; it will only create conflicting signals and analysis paralysis. Stick to price action, volume, and two or three complementary indicators.
- Ignoring Higher Timeframes: A bullish setup on a 15-minute chart will likely fail if the daily and weekly charts are in a massive downtrend. Always align your trades with the macro trend.
- Trading Before the Candle Closes: Crypto is notorious for “Darth Maul wicks” (long wicks on both the top and bottom of a candle). Never assume a breakout is confirmed until the candle actually closes. What looks like a massive breakout with 5 minutes left on the clock can easily retrace into a bearish trap.